For MIT Professor Armando Solar-Lezama, one of the most common misunderstandings about AI is the notion that it can be dropped into existing human roles like a plug-and-play replacement.
David Clark, Senior Research Scientist at MIT CSAIL, helped design the system that connects nearly every computer on earth. As Chief Protocol Architect of the Internet from 1981 to 1989, he was there for the beginnings of the Internet. Calling the wave of AI technology an “echo” of what happened in the 80’s, Dr. Clark is cautioning, “ maybe we need to slow things down and think a bit.”
What happens when the team behind PlayStation meets the researchers pushing the boundaries of AI? You get The Nexus of Games and AI, a 12-part MIT Independent Activities Period (IAP) course, now available to stream.
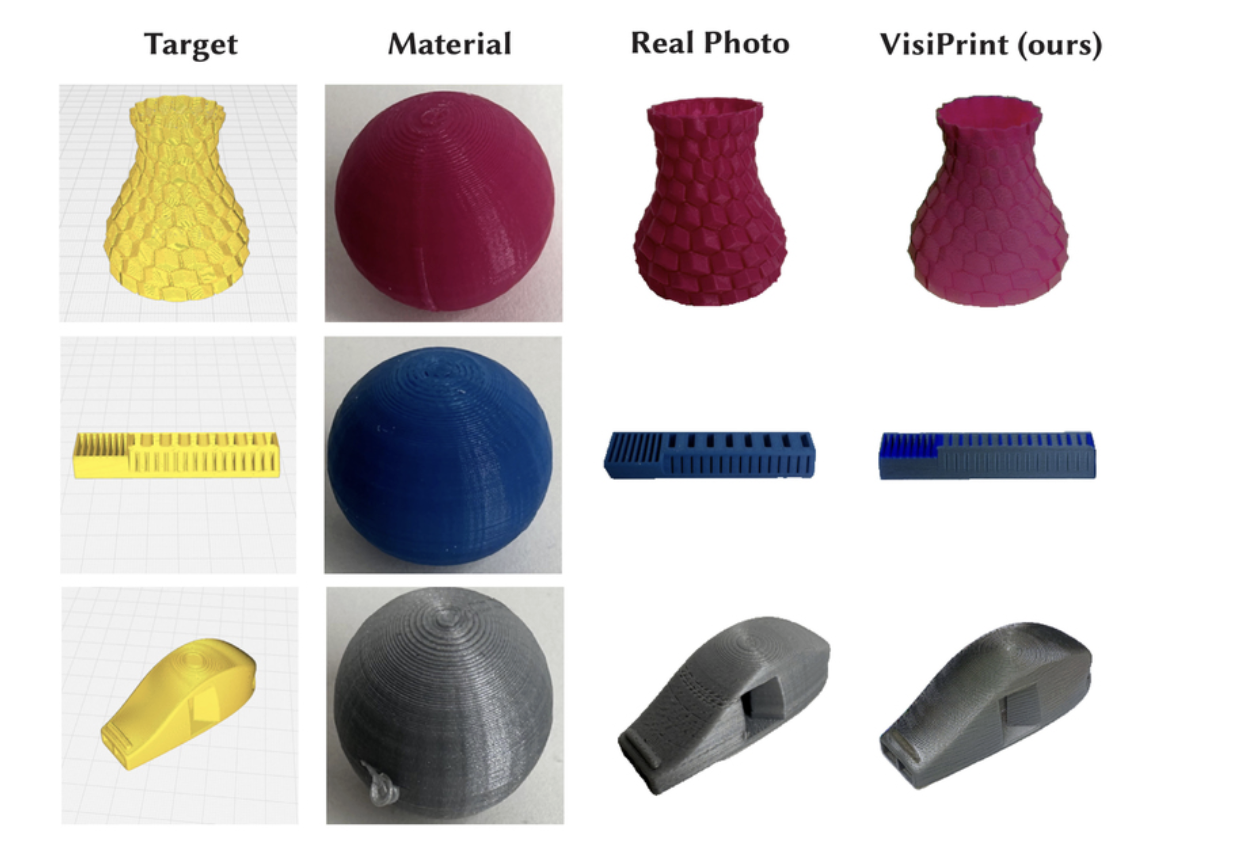
Designers, makers, and others often use 3D printing to rapidly prototype a range of functional objects, from movie props to medical devices. Accurate print previews are essential so users know a fabricated object will perform as expected.
Young adults growing up in the attention economy — preparing for adult life, with social media and chatbots competing for their attention — can easily fall into unhealthy relationships with digital platforms. But what if chatbots weren’t mere distractions from real life? Could they be designed humanely, as moral partners whose digital goal is to be a social guide rather than an addictive escape?
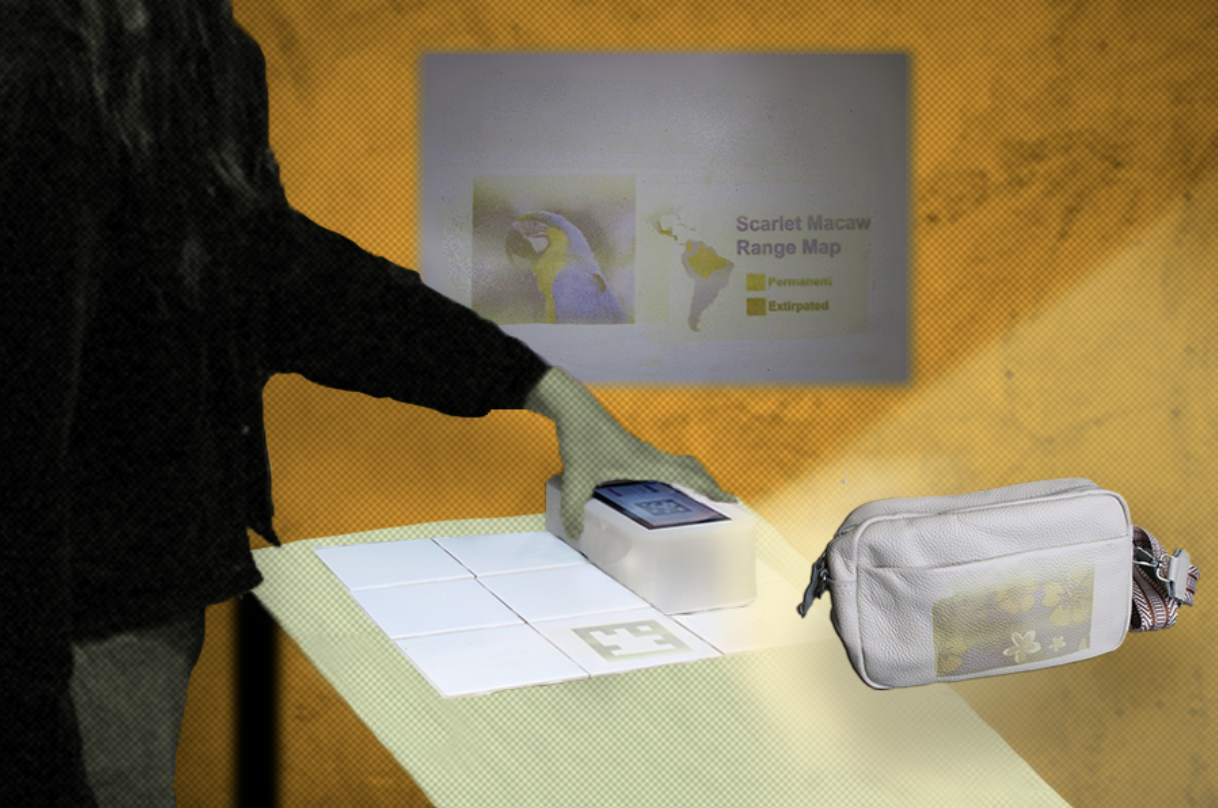
Imagine a world where you could change the designs you see on bags, shirts, and walls whenever you want. Typical clothes would become customizable fashion pieces, while your humble abode could turn into a smart home. That’s the vision of scientists like MIT PhD student Yunyi Zhu ’20, MEng ’21: technology that can “reprogram” the appearance of personal accessories, home decor, and office items.
In high-stakes settings like medical diagnostics, users often want to know what led a computer vision model to make a certain prediction, so they can determine whether to trust its output.
Ever had an idea for something that looked cool, but wouldn’t work well in practice? When it comes to designing things like decor and personal accessories, generative artificial intelligence (genAI) models can relate. They can produce creative and elaborate 3D designs, but when you try to fabricate such blueprints into real-world objects, they usually don’t sustain everyday use.